There’s been a lot of chatter this year about the breadth of the stock market’s performance. While the S&P 500 is up 8.5% this year the majority of that performance is being driven by just a handful of the stocks. For example, the equal weight S&P 500 (which invests in an equal weighting of the 500 companies as opposed to letting the market cap float) is actually DOWN -0.5% this year. But the market cap weighted S&P 500 index (the index you see on the news) is being driven largely by a handful of megacap tech stocks because the Nasdaq 100 (which is mostly tech companies) is up 28% this year. What do we make of all this?
Well, first of all, I think we shouldn’t read too much into all this short-termism. It’s fun to talk about the stock market in the short-term, but one thing I love about my All Duration investing strategy is that it specifically defines the stock market as an 18 year instrument. It gives investors a crystal clear understanding of the specific time horizon over which all their assets work for them. So while it’s fun to talk about what stocks do in 18 minutes or 18 months, it should really be inconsequential to your short-term financial plan because your stock allocation is serving an inherently long-term goal in your portfolio.
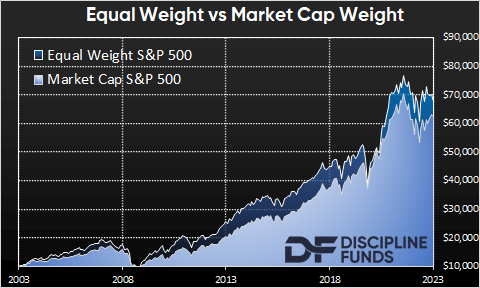
But zooming out actually gives us a better perspective on this story as well. And when we zoom out we see a much different story. We now have 20 years of real-time market data from live market cap and equal weight ETFs (SPY vs RSP). The performance is interesting because the equal weight index has outperformed by almost 1% per year. But it’s also come with added risk along the way where the standard deviation has been 2% higher and the maximum drawdown was 5% deeper. On the whole they’ve looked very similar though, but to earn that slight premium you needed a little stronger stomach.
The reasons for this are somewhat controversial, but the basic gist of what happens in an equal weight index is that you underweight the larger capitalization firms because of the way the fund rebalances. So, for instance, if you owned 10 stocks in an equal weighting and you just let them float then the best performers get larger and larger. If you continue to let them float (as opposed to rebalancing them back to equal weight) then your performance becomes increasingly skewed by the bigger companies. In the case of the market cap weighted S&P 500 the recent performance has been driven primarily by this skew due to the megacap tech companies like Amazon, Microsoft and Apple.
This isn’t exactly normal though. Traditionally the equal weight index has performed a bit better because it has what is essentially a smaller cap tilt and exaggerated momentum effect. So while Apple and Microsoft make up 7% each in the S&P 500 MC they are just 0.25% in the equal weight index. Historically, tilting away from the floating market cap has added a little bit of risk by maintaining higher relative exposure to smaller riskier companies (that can potentially grow more). But this year the exact opposite is happening. The larger companies are outperforming and adding a disproportionate return to the market cap weight. This is good unless it becomes bad. By being more concentrated in certain firms you expose yourself to more single entity risk. So there’s currently more of a momentum effect in the market cap weighted ETF and when momentum is good it’s really good. And when it’s bad it can be really bad.
In the past I’ve talked about how the beauty of a systematic equity index fund is that you have some embedded momentum effect in the inherent fund structure. Some firms shrink and naturally fall out of the index and others grow into the index. Typically, the equal weight index exacerbates this effect because smaller companies displace larger companies. But in a year like 2023 the bigger firms are growing much faster than the smaller firms so the momentum effect, while still existing in both, is reversed. Whether this is good or bad is unknown, but we know that the market cap weighted S&P 500 is concentrating more and more risk in the bigger companies. That would naturally lead us to believe that that means the S&P 500 is presently riskier than the equal weight index.
What to do, what to do?
Here at Discipline Funds we tend to think that investors overcomplicate a lot these things. You can spend lots of time trying to pick the best stocks, best sectors or best index funds. And sometimes you’ll outperform and sometimes you won’t, but in the long-run it won’t make a huge difference after taxes and fees. In fact, the SPIVA scorecards make it pretty clear that 85%+ of the more active investors will end up underperforming (this is probably higher if you actually calculated your after tax, after fee, after stress returns). And while we don’t have a problem with factor tilting and trying to outperform the market we do tend to think that simpler is better.1 And in this case, as my wife likes to say, it’s “6 of 1 or half dozen of another”.
The bottom line is, in the long-run these are very similar indices on a risk adjusted basis and there’s nothing wrong with owning the equal weight index as long as you know you’re using a factor tilt that takes a little more risk. At the same time, it’s useful to understand that while this is true in the long-run it’s not always true in the short-term. And now is one of those times where the market cap weighted S&P 500 is generating that 8.5% return by taking a much more concentrated risk relative to other broad markets.
1 – I’ve been somewhat critical of factor investing over the years despite being a value investor at heart. That’s not because I don’t believe the factor evidence. It’s because I think picking the right factors at the right time is very difficult and not always worth the guarantee of higher fees. And if you just buy the market cap index then you own all the factors all the time rather than trying to pick and choose when certain factors will do better. So I tend to just defer to simple is better and in this case the market cap weight is simpler.