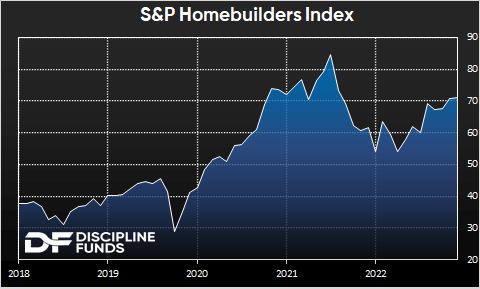
It’s only May, but if I had to pick a chart of the year it would be housing stocks. In fact, housing as a whole has been remarkably resilient this year. If you’d told me that there would be a bank panic and 7% mortgage rates in May I would have predicted that the housing market was cratering. And sure, it hasn’t exactly been a raging bull market. After all, the NAHB Housing Market Index has been cut in half and existing home sales have cratered. Housing market data is broadly negative. Yet homebuilder stocks are up 16% year to date and are only about 18% off the all time highs.
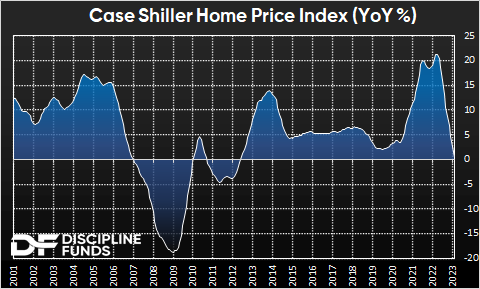
A big part of this is that the housing market has held up better than many predicted. The Case Shiller Index is flat on a year over year basis and just 5% off the all-time highs. Now, I want to be careful here because I could have said the exact same thing in 2007, but I do believe this time is different.1 The biggest difference is that Covid changed housing in a meaningful way where work from home has altered the landscape of every home in the country. So you have this strangely bifurcated real estate market where the commercial side is more at risk than it’s ever been, but residential is resilient because people value their home more than ever. Add in the well documented inventory issues and you have a macro landscape that is very different from 2008.
On the other hand, while this might not be 2008 it’s hard to see a continued housing boom given the low demand due to unusually high mortgage rates. After all, no one has to buy and in an environment where the price to rent ratio remains unusually wide we should expect home prices to remain under modest pressure relative to rents.
My forecast remains unchanged relative to a few months ago – we are in the midst of a long drawn out process where high overnight interest rates put substantial downward pressure on housing demand at a time when rents, while increasing, are much more affordable on a relative basis. These two prices will converge. It’s not a matter of if in my view, but when. And the “when” in this equation is a long drawn out process mainly because housing is such a slow moving part of the economy. This is a multi-year process in the making and we should not be surprised to see national home prices down 10-15% by the time this process is finished. In the meantime, much of the downside risk depends on how long the Fed remains tight. So far it looks like higher for longer for interest rates. That’s not good for housing and real estate more broadly.
All of this is consistent with our forecast at the beginning of the year for a “muddle through” economy. We’re still digesting the Covid boom and while it might not necessarily result in a huge bust it remains an environment with substantial sluggishness and downside risks.
1 – Yes, I did just utter the four most dangerous words in investing. But isn’t it always a little different this time? History rhymes, but rarely repeats and we need to be careful about fighting the last war.