This week’s chart of the week shows the standard credit cycle and how it coincides with booms and busts across time. It typically works something like this:
- Economic expansion
- Economic expansion turns into economic boom
- Inflation moves above Fed target
- Fed raises rates
- Rate hikes lag so Fed keeps raising
- Yield curve inverts
- Fed stays tight as inflation data remains sticky
- Consumers borrow more to make up lost income in slowing sectors
- Lending standards increase as credit quality deteriorates (YOU ARE HERE)
- Economy slows as credit expansion erodes
- Recession
- Fed reduces rates
- Rinse, wash, repeat
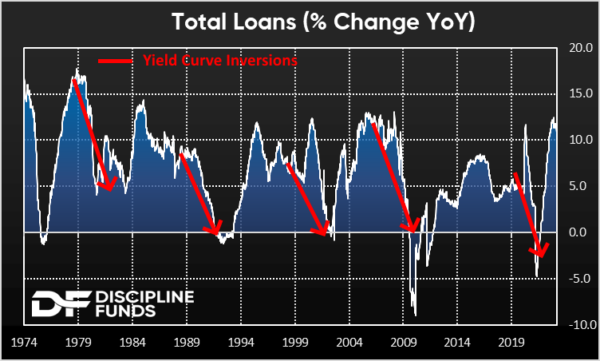
So far, this is playing out pretty much exactly to schedule. People were skeptical about my comments 6 months ago about how inflation risk would slowly transition into credit risk, but with the collapse of SVB I think that call has been resoundingly confirmed. Credit risk isn’t just creeping up on us. It punched everyone in the face this week. And it is likely to get worse.
The reason I say that is because borrowing hasn’t actually slowed all that much yet. If you look at the above chart you can see that the credit cycle follows this fairly systematic playbook. But we’re right at the peak credit growth and it’s only just starting to show signs of rolling over. Lending standards were already surging, credit spreads were expanding and we know the Fed is going to remain tight. So the question now is: “how much does lending decline and does it decline so much that it causes a larger downturn than expected?” If history is any guide we should expect a meaningful decline in borrowing in the coming 12-18 months. How deep that decline is will determine whether the Fed made a small mistake raising rates so fast or whether they made a very big mistake that is going to require them to backpedal.