Did you hear that the bond market is crashing everywhere? That’s right. If you open up the financial news today you’ll see these three headlines as the top bond market news:
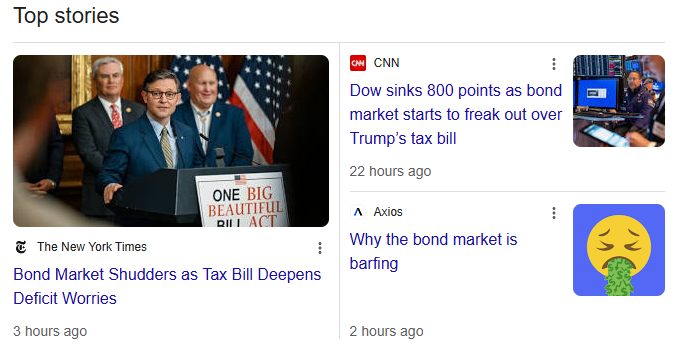
My goodness. Sounds like it’s bunker time! But is it? No. And not even remotely close. In fact, these headlines are absurd. I’d even go so far as to say they’re embarrassing. Now, I’m not typically one to bash the “mainstream media”, but if the mainstream media wants to regain its credibility in a world where people are increasingly questioning it then they have to start doing A LOT better than this. Let’s put all of this in perspective.
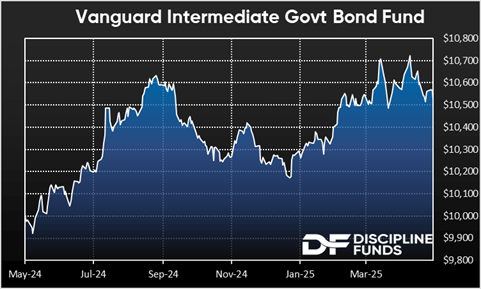
First, the US Government bond market is comprised of many different types of outstanding maturities ranging from overnight instruments to 30 year instruments. The average weighted outstanding maturity of these instruments is currently 71 months, about 5.9 years. In the last year a bond fund holding this average weighting has a POSITIVE return of 5.5%. So far this year that instrument is up 2.5%. That’s 3% better than the S&P 500 has done so far this year. Perhaps more importantly, that instrument is currently undergoing a -1.9% drawdown from its recent highs in April. In other words, there’s no panic in the bond market. There is no barfing. The bond market is not “shuddering” or “freaking out”. In fact, if you’d gone to sleep a year ago and just woken up today to look at interest rates you’d probably think that nothing really happened as 6 year interest rates are virtually unchanged from where they were a year ago.
In fairness, there are small parts of the bond market that are reacting more sensitively than others. And that’s typical of any market. If tech stocks fell 10% while the S&P 500 was up 2.5% I wouldn’t go writing articles about how “the stock market” is barfing. I probably wouldn’t even write anything about this because that’s how these instruments work – longer duration instruments are more sensitive than shorter duration instruments. And in the bond market it’s important to look at the average weighted outstanding maturities to get a proper perspective on how “the bond market” is behaving.
Now, what did happen in the last few months is that interest rates fell quite a lot in anticipation of a potential tariff-induced recession and then rates reverted higher to where they were right before the whole tariff fiasco unfolded, when we unwound a lot of the tariffs. But on the whole interest rates have been mostly flat for over 2 years now.
So, now that I got that off my chest – where are we with bonds and what should we expect going forward?
As you probably know, I like to look at bonds across expected time horizons. Bonds are best used in asset-liability matching strategies to help people manage cash flows over specific time horizons. For example, I meticulously manage all my cash holdings in T-Bills for expenses coming in the next 12-24 months in a strategy I call “T-Bill and chill”. You can ladder this out as long as you want to help navigate expenses over specific time horizons, but in my opinion bonds are best used in shorter planning time horizons, typically something less than 10 years and with an average money weighted allocation of less than 5 years, because it’s virtually impossible to predict 10+ year expenses and in my view if you have that sort of time horizon then you should be allocated to higher return assets like stocks or, at a minimum, buying multi-asset instruments that have a higher expected 10 year returns than something like a vanilla 10 year, which is only going to get you 4.5% over the next 10 years.
So, where is the sweet spot in the bond market today? Well, that depends on your specific planning needs, but on average I like to use the concept of what I call “escape velocity” to measure this. That’s the point of indifference for an investor who has a certain interest rate sensitivity relative to current interest rates. For instance, if you buy a 12 month T-Bill today you’re getting about 4%. That’s great for a 1 year period because your instrument won’t change in value relative to rate changes. But you do have reinvestment risk over longer time horizons so you might consider trying to create a portfolio where you can “chill” a little longer. So, if you have a 5 year time horizon with some money then you should consider reducing that reinvestment risk by buying something that’s slightly longer in duration, but also not overly sensitive to interest rate changes. That’s what escape velocity tries to measure by quantifying the current interest rate relative to the interest rate sensitivity. For example, if you bought a 5 year T-Note today you’d be buying an instrument with a 4.10% annual yield. But this instrument also has a duration of 4.5 which means that if interest rates go up by 1% then your coupon will not offset the change in principal. It’s not a huge deal, but as you can see in the following chart it starts to really slip off a cliff the further out you go. In other words, escape velocity is the current rate relative to interest rate sensitivity where you “escape” duration risk. And at present that maturity is about 4.5 years as that’s the maturity range where your current interest rate is roughly equal to your interest rate risk. This is the spot on the curve that I would currently describe as the sweet spot for the bond market. It’s not too hot and not too cold.
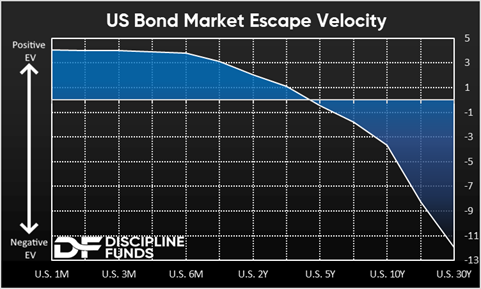
Of course, we’re not making an interest rate estimate within all of this. I am not predicting where rates will go. I am just using current rates relative to a standard 1% interest rate change in standard bond duration calculations. But as a general rule for planning out longer liability matching needs this is about as far as I would go on average while still maintaining what I would say is a very high degree of certainty in terms of financial planning.
In short, the bond market isn’t panicking. In fact, I’d argue the bond market looks vastly better today than it has in a long time and it seems to have finally found its footing after the 2022 fall. If you held a gun to my head I’d guess that interest rates also have asymmetric downside risk here. That is, if you asked me if 10 year rates were more likely to go to 6.5% or 2.5% (from 4.5%) I’d say the likelihood of 2.5% is MUCH higher. That’s a guess and probably a topic for another day since that involves all sorts of recession and inflation guesstimates. But the short story here is, don’t fall for the media driven bond panic narratives. If you continue to manage your bond exposure in the proper time horizons the bond market is acting about the best it has in a very long time.